


.png)


Knowing you need to evaluate a model's outputs and knowing exactly which method to use are two different problems. How to evaluate LLM outputs depends heavily on what you're actually trying to measure — reference-based accuracy, semantic similarity, or subjective quality all call for different tools, and using the wrong one produces numbers that look precise but don't actually answer the question you care about.
LLM evaluation metrics split roughly into two categories: automated metrics that compare outputs against a reference or score them algorithmically, and human evaluation methods that apply structured judgment where automated metrics fall short. Most real evaluation work uses both, matched deliberately to the specific quality dimension being measured.
Choosing the wrong metric for a given evaluation question produces results that look rigorous but don't actually validate what matters. Google Research's "Data Cascades" study documented how such subtle mismatches — measuring the wrong thing confidently — tend to surface later as harder-to-diagnose problems once decisions have already been made based on flawed evaluation data (Sambasivan et al., Google Research).
NIST's AI Risk Management Framework emphasizes that evaluation methods need to be matched to the specific risk and use case being assessed, not applied generically — directly relevant to choosing the right combination of automated and human evaluation for LLMs rather than defaulting to whichever metric is easiest to compute (NIST AI RMF).
The stakes rise with how widely these models are deployed. Stanford HAI's AI Index has tracked the rapid expansion of LLM use across consumer and enterprise applications (Stanford HAI, AI Index Report), meaning an evaluation gap discovered after deployment affects a much larger number of real interactions than it would have during a smaller-scale pilot.
LLM output quality assessment typically draws from a specific toolkit, matched to what's being measured.

Reference-based automated metrics. BLEU and ROUGE compare generated text against a reference answer, measuring word or phrase overlap — useful for tasks like summarization or translation where a reasonably specific correct answer exists, less useful for open-ended generation.
Perplexity and likelihood-based metrics. These measure how "expected" a model's output is given its training, useful for gauging fluency and coherence but not a direct measure of factual accuracy or task success.
Embedding-based similarity metrics. These measure semantic closeness between a generated output and a reference using vector representations, capturing meaning-level similarity even when exact wording differs — more flexible than word-overlap metrics for open-ended tasks.
Structured human evaluation. For dimensions like helpfulness, tone, and appropriateness, human evaluators apply defined rubrics and rating scales, since these qualities don't reduce cleanly to an automated score.
Understanding how these workflows operate — which metric answers which question — is what prevents teams from reporting a precise-looking number that doesn't actually validate the quality dimension that matters most for their use case.
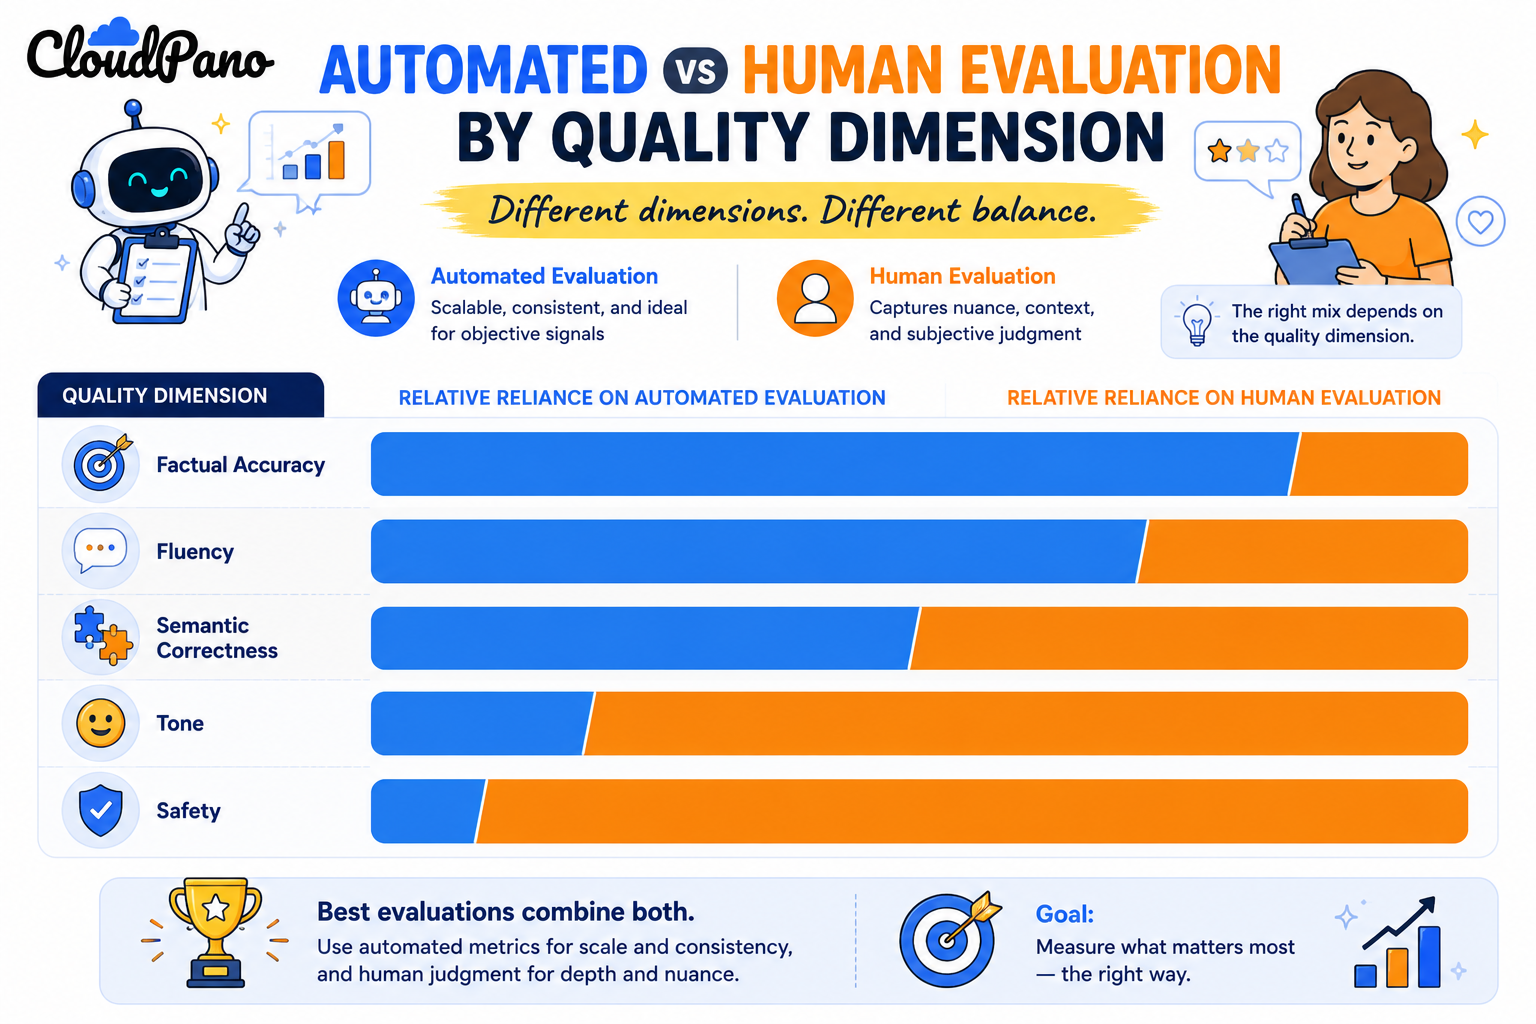


BLEU and ROUGE for reference-based text overlap, perplexity for fluency and coherence, and embedding-based similarity metrics for semantic closeness — each suited to a different kind of evaluation question.
For subjective qualities like tone, helpfulness, and appropriateness that don't reduce cleanly to a reference-based or algorithmic score, structured human evaluation with a clear rubric is typically necessary.
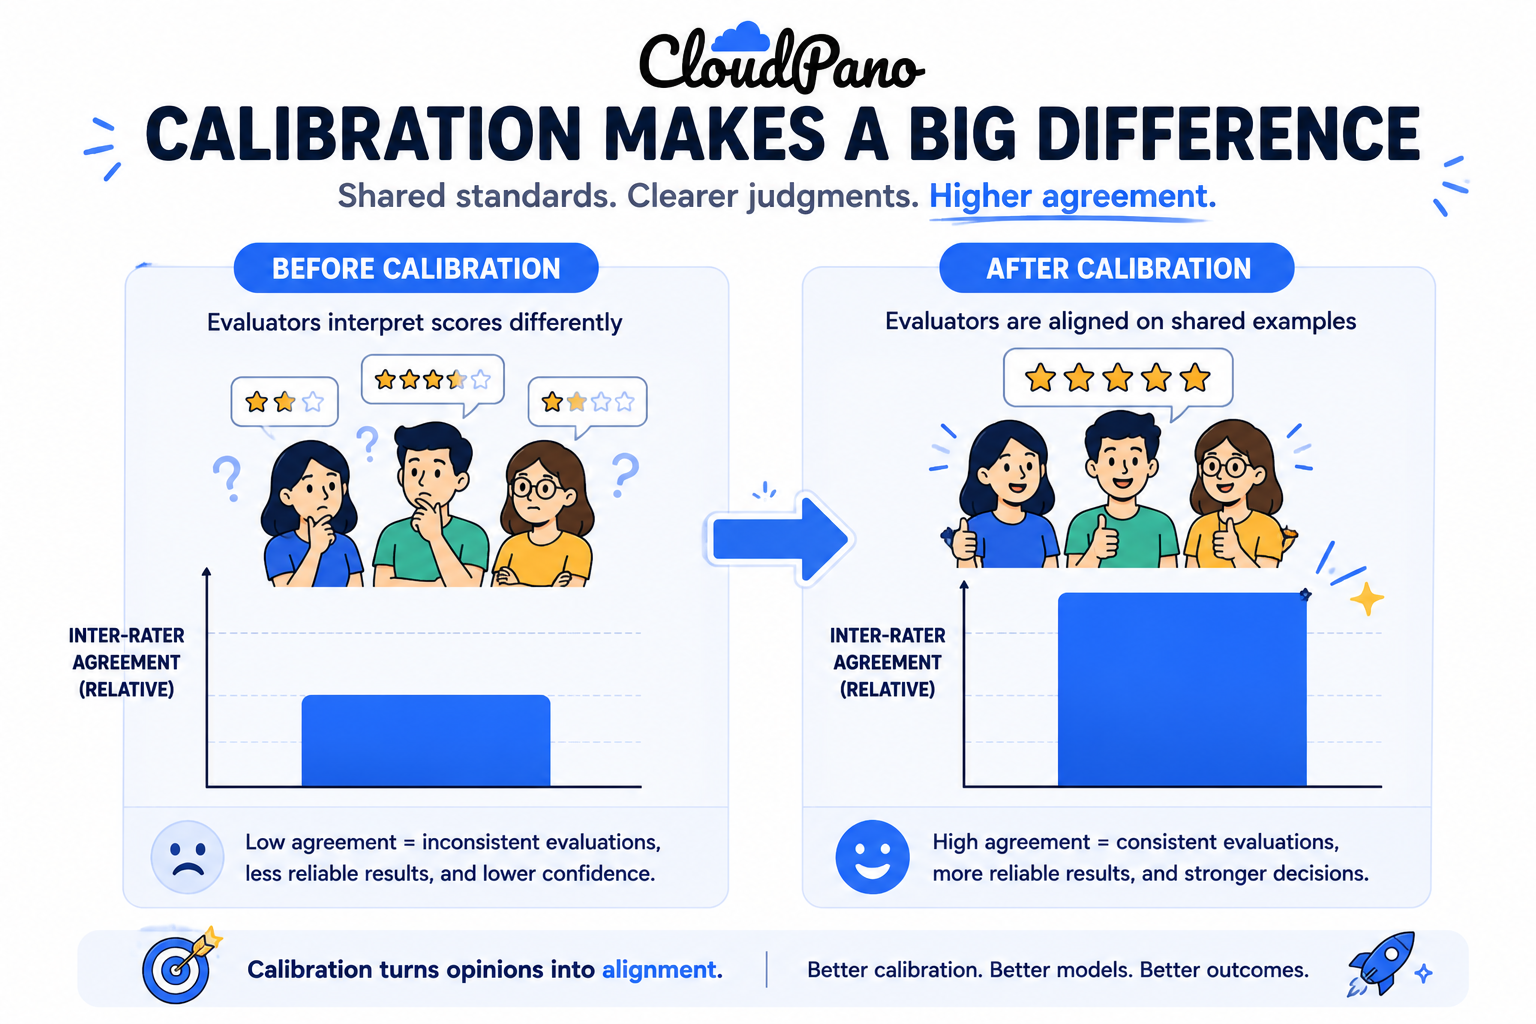
Define specific, concrete criteria for each quality dimension and a defined rating scale, then calibrate evaluators against shared example ratings before running full-scale evaluation.
It measures how consistently different evaluators rate the same outputs; low agreement signals that a rubric needs refinement, since inconsistent scores don't reflect a shared, reliable standard.
No. Automated metrics handle scorable dimensions like reference-based accuracy efficiently, but subjective qualities like tone and appropriateness generally still require structured human judgment.
Because blending scores together can hide specific weaknesses — a model might score reasonably overall while underperforming badly on one particular dimension that gets averaged out.
This depends on your specific use case and the variability of your outputs, so it's best scoped to include a representative range of typical cases and known edge cases rather than a fixed general number.
How to evaluate LLM outputs comes down to matching the right method to the right question — automated metrics like BLEU, ROUGE, and embedding similarity for scorable dimensions, and structured human evaluation with calibrated rubrics for subjective qualities that don't reduce to a number. Reporting results by dimension, rather than blending everything into one score, is what actually reveals where a model needs work.


Compact, ready to go anywhere
Interchangeable lens that’s upgradeable
Dual 1-inch sensors for improved clarity and low light performance
Dynamic range and 6K 360° capture
360° photo resolution at 21MP

8K 360° video recording for ultra-detailed visuals.
4K single-lens mode for traditional wide-angle shots.
Invisible selfie stick effect for drone-like perspectives.
2.5-inch touchscreen with Gorilla Glass protection.
Waterproof up to 33ft for underwater shooting.

360° photo resolution in 23MP
Slim design at 24 mm thick
Built-in image stabilization for smooth video capture.
Internal 19GB storage for photo and video storage.
Wireless connectivity for remote control and sharing.

60MP 360° still images for high-resolution photography.
5.7K 360° video recording at 30fps.
2.25-inch touchscreen for intuitive control.
USB Type-C port for fast charging and data transfer.
MicroSD card slot for expandable storage.
.png)

.png)

Try it free. No credit card required. Instant set-up.







.svg)


.svg)