


.png)


A monthly number on a pricing page tells you almost nothing about what you're actually going to pay over the life of your virtual tour library. Understanding virtual tour software pricing properly means looking past that headline figure to the underlying structure — what drives cost up as you scale, what's bundled versus billed separately, and how that structure fits your specific usage pattern. This guide breaks down what you're really paying for, across platforms generally, so you can compare options with more than a single number.
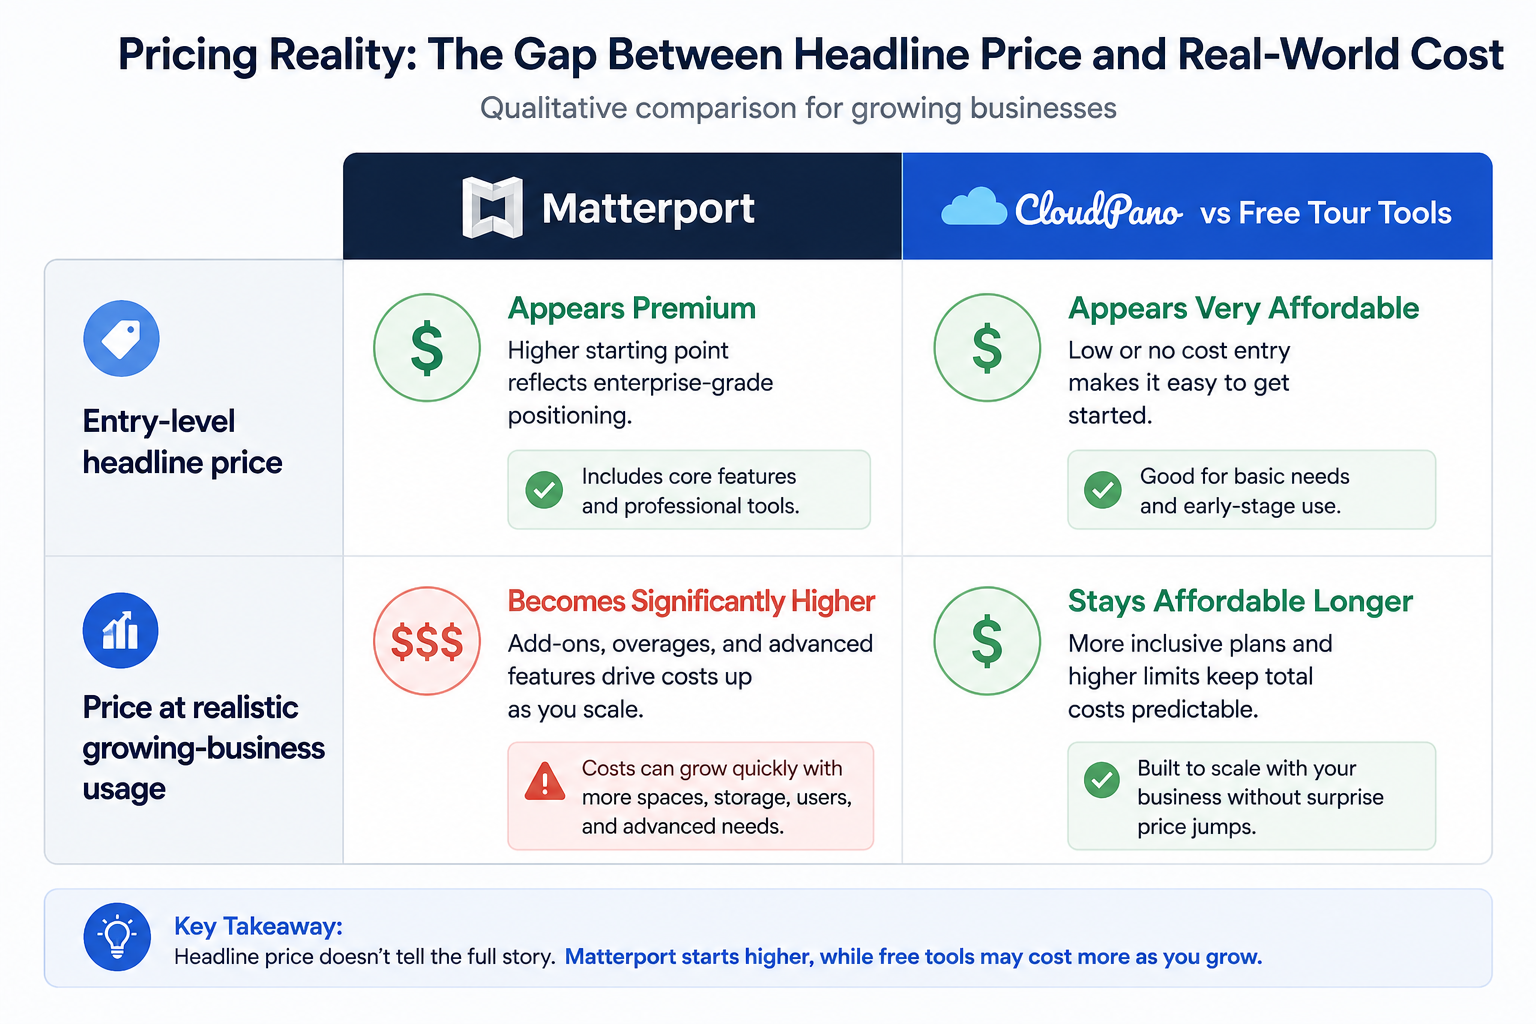
Every virtual tour platform publishes a starting price, and that number is almost always the most favorable case — the lowest tier, minimal usage, no add-ons. It's a reasonable anchor point, but it's rarely what a business with a growing, active tour library actually ends up paying. The real cost depends on how a platform's pricing structure interacts with your specific usage over time, not the number that appears in a Google search result.
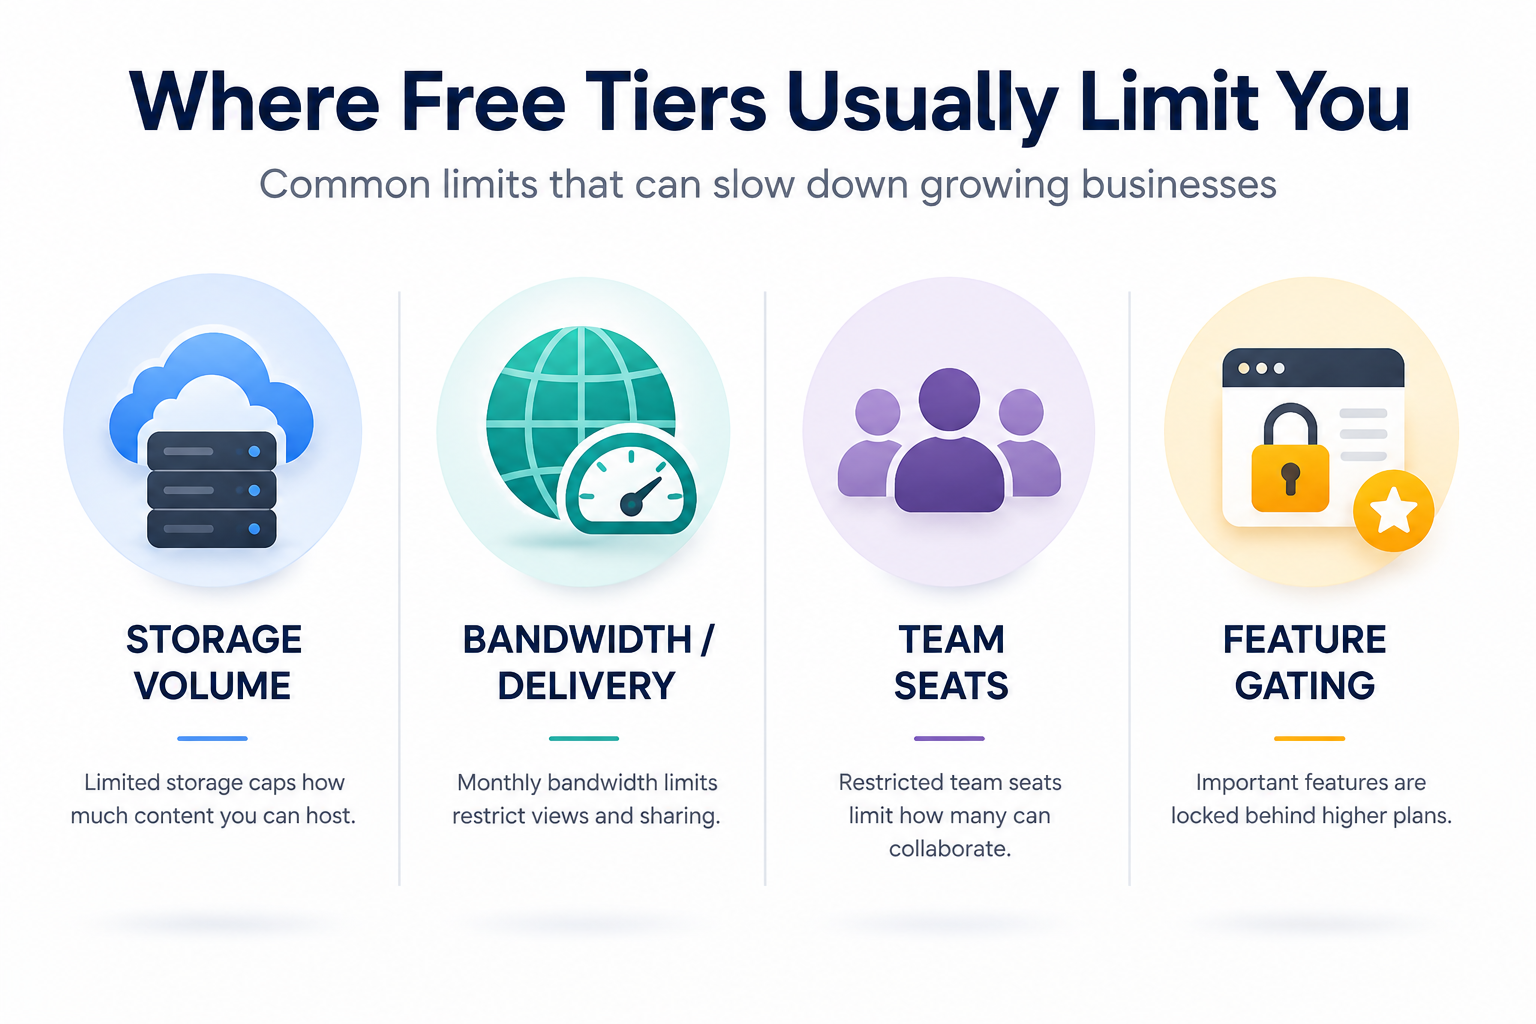
Regardless of which specific platform you're evaluating, a few underlying factors tend to drive the actual cost you'll experience:
Storage volume. How many tours you're hosting simultaneously, and whether older, less-active tours continue counting against your plan.
Bandwidth and delivery. How much traffic your tours receive, and whether that's bundled generously or metered with potential overage costs.
Team seats and permissions. Whether additional users cost extra, and at what increment.
Feature tier gating. Whether capabilities like advanced analytics, deep branding customization, or higher-resolution capture support require a premium tier.
Understanding which of these actually matters most for your business is more useful than comparing headline prices across platforms, since different businesses are affected very differently by each driver.
Matterport cost has historically been structured around tiers tied to the number of active spaces hosted, with storage and bandwidth factored into which tier is required. This tends to work predictably for a small, stable library, but creates steady upward pressure as your library grows, since older tours generally continue counting against your footprint even if they're rarely viewed.
This structure means the effective cost per active tour can increase over time for businesses producing content regularly, even without a formal price increase — the underlying mechanics of the tier system do a lot of the work.
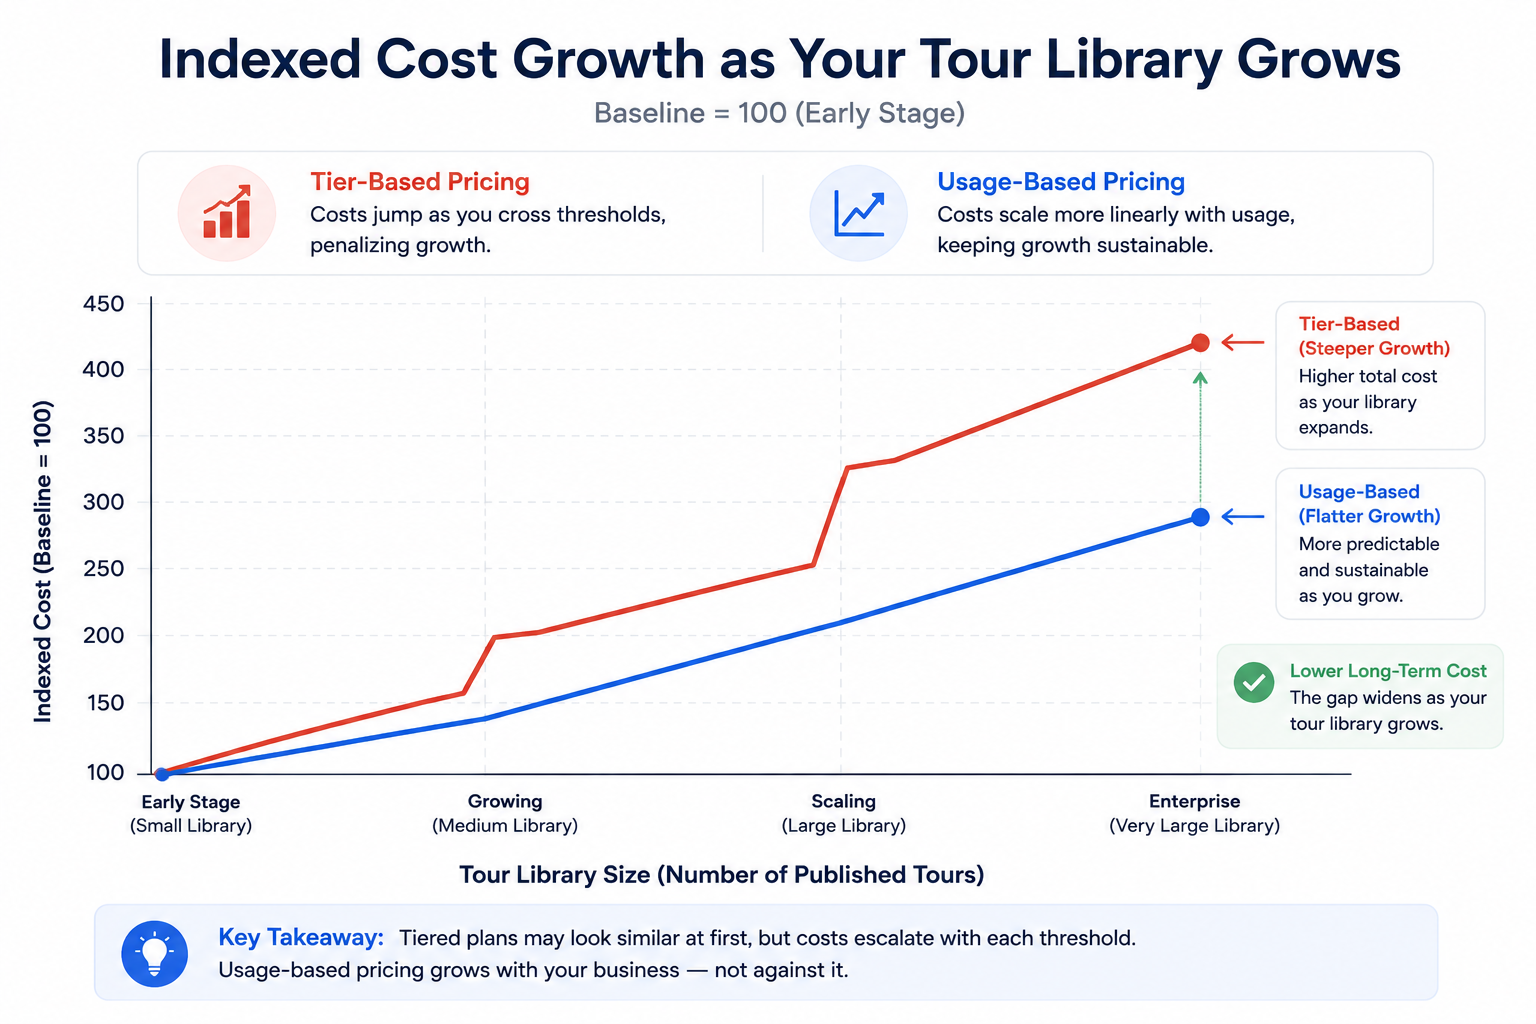
CloudPano cost has generally been structured to bundle more generously at each tier, aiming for a more predictable relationship between actual usage and price as a library scales. This doesn't necessarily mean every entry-level tier is cheaper in isolation — it means the relationship between growing usage and growing cost tends to be more linear and predictable, which matters more to a business with an actively growing library than the sticker price of a starter tier.
As with any platform, confirming current, specific tier details directly against your own expected usage is worth doing before committing, since general positioning can shift over time.
Beyond the tier structure itself, it's worth accounting for costs that sit outside a platform's published pricing entirely. Time spent managing account settings, troubleshooting a billing question, or migrating away from a platform later all carry real cost, even though none of it appears on a pricing page. These "soft costs" are harder to quantify than a subscription fee, but they're worth weighing qualitatively when a decision is otherwise close on paper.
A platform with slightly higher published pricing but notably better support responsiveness, or clearer billing communication, can end up being the lower-total-cost option once you account for the time your team would otherwise spend managing friction with a cheaper-looking alternative. This is admittedly harder to compare directly than a tier price, but it's worth asking about directly — support responsiveness, billing transparency — during any trial or sales conversation, rather than assuming it's roughly equal across every platform.
A meaningful 3D tour software pricing comparison doesn't stop at comparing entry-level prices — it means mapping your own realistic usage (tour volume, team size, feature needs) against the tier on each platform that actually covers that usage completely, then comparing those specific tier prices to each other.
This is a more work upfront than glancing at two pricing pages, but it's the only comparison that actually reflects what you'd pay in practice, rather than what a best-case scenario suggests.
Most platforms in this category offer some discount for committing to annual billing over monthly, which is worth understanding as a distinct factor from the tier structure itself. An annual commitment can meaningfully lower your effective cost if you're confident in your usage pattern, but it also reduces your flexibility if your needs change significantly partway through the year. This tradeoff is worth weighing deliberately rather than defaulting to whichever billing option is presented first or most prominently on a pricing page, since the "recommended" option is often the one that benefits the vendor's cash flow as much as it benefits your bottom line.
For a business still validating whether a given platform is the right long-term fit, starting on monthly billing and switching to annual once you're confident is a reasonable, low-risk approach, even if it means paying a slightly higher rate during that initial validation period.
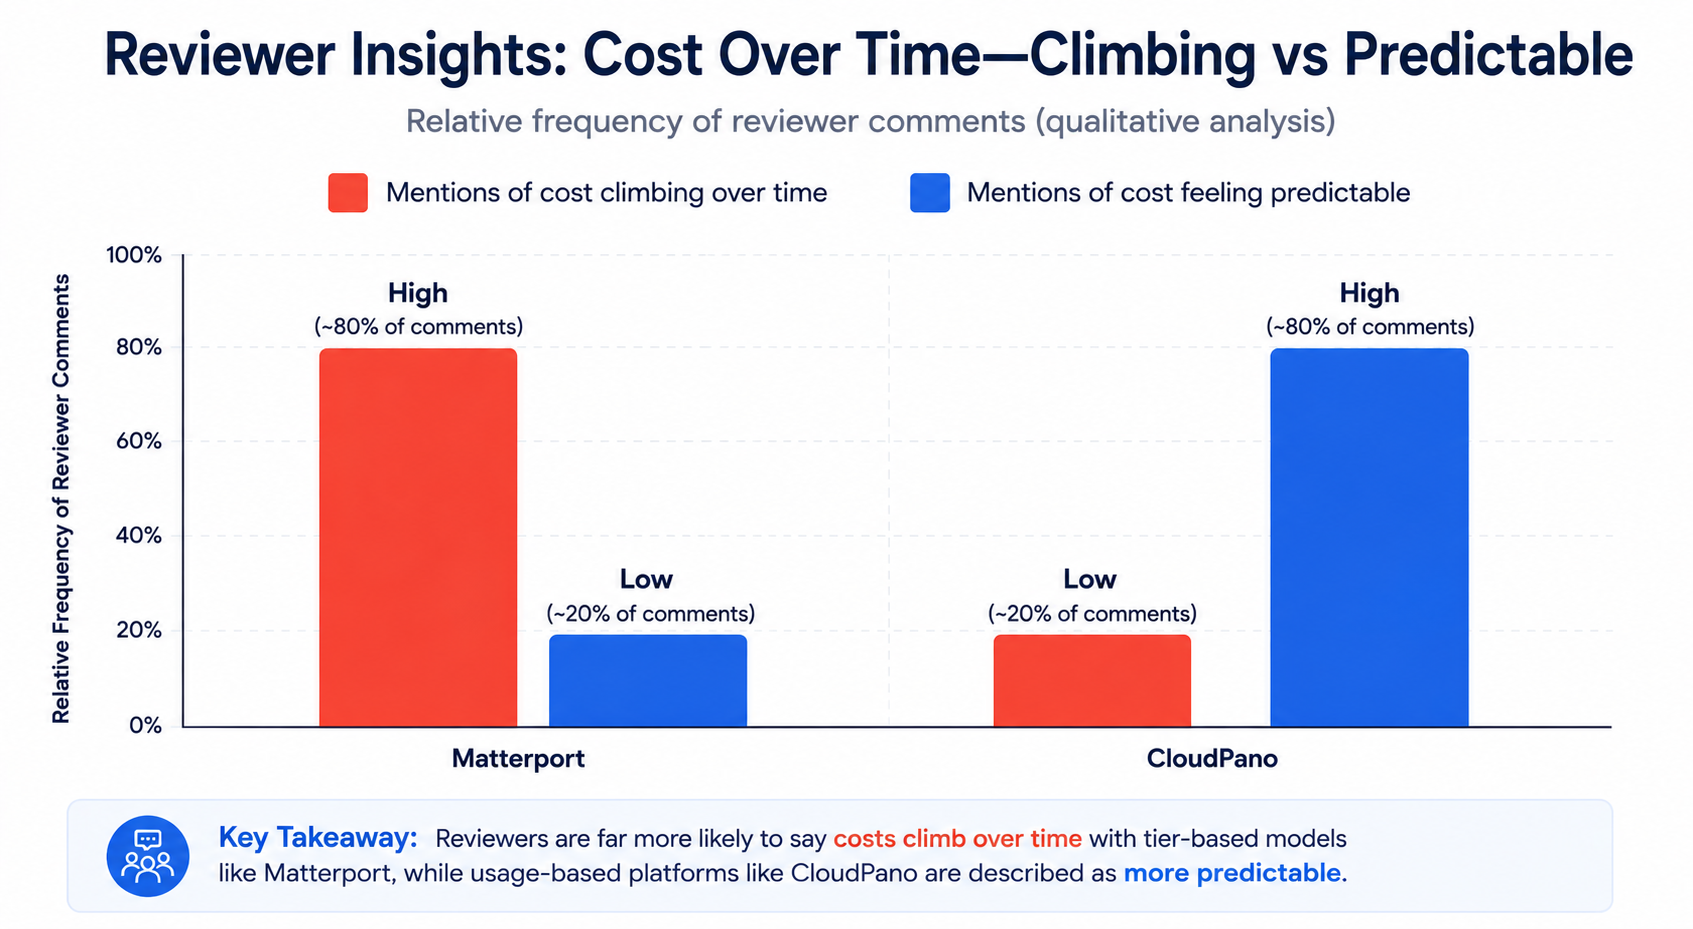
On G2's virtual tour software category page, a recurring theme in Matterport reviews is a sense of cost climbing steadily over time relative to output, particularly among reviewers with a growing tour library — directly reflecting the tier mechanics discussed above.
Capterra's virtual tour software listings offer a similar cross-platform view, useful for filtering reviews specifically by mentions of pricing or value, rather than general satisfaction.
"Isn't comparing tiers instead of headline prices just more work for a marginal benefit?"
For a business with minimal, stable usage, headline price comparison may be close enough. For a business with a growing library, team, or feature needs, the gap between headline price and actual cost at your real usage level can be substantial — worth the extra half hour of comparison before committing to an annual plan.
"What if my usage changes after I've committed to a tier?"
This is worth expecting rather than avoiding. Most platforms allow tier changes as usage shifts, and revisiting this comparison periodically as your business changes is a reasonable practice rather than a one-time decision made permanently at signup.
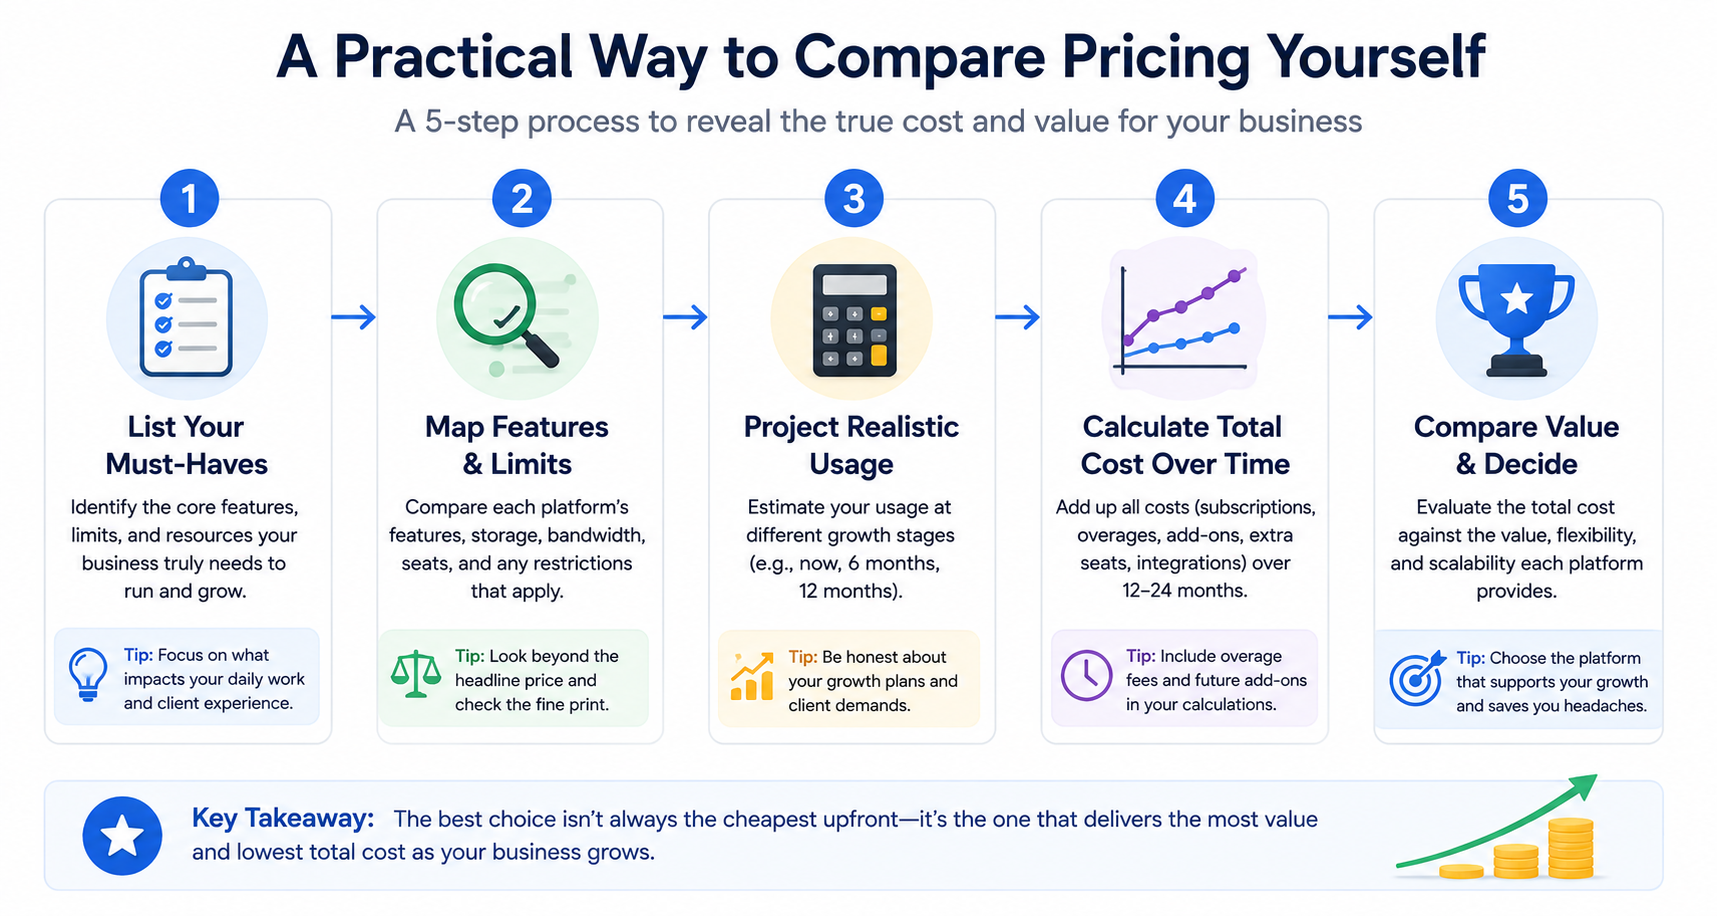
Virtual tour software pricing is genuinely difficult to compare fairly using headline numbers alone, since the underlying structure — storage handling, bandwidth bundling, team costs, and feature gating — determines what you'll actually pay far more than the advertised starting price does. Comparing platforms at the tier that actually covers your real usage, rather than the cheapest advertised tier, is the only approach that reflects reality.
If predictable cost scaling as your library grows matters to you, it's worth running this comparison directly against CloudPano using your own realistic usage estimate. And if you want a deeper look at how storage and bandwidth specifically affect this comparison, our dedicated article on hosting costs covers that ground in more depth. Between understanding the structural cost drivers here and digging into the specific mechanics in that companion piece, you should have enough to make a genuinely informed comparison rather than relying on a single number from either company's homepage.


Compact, ready to go anywhere
Interchangeable lens that’s upgradeable
Dual 1-inch sensors for improved clarity and low light performance
Dynamic range and 6K 360° capture
360° photo resolution at 21MP

8K 360° video recording for ultra-detailed visuals.
4K single-lens mode for traditional wide-angle shots.
Invisible selfie stick effect for drone-like perspectives.
2.5-inch touchscreen with Gorilla Glass protection.
Waterproof up to 33ft for underwater shooting.

360° photo resolution in 23MP
Slim design at 24 mm thick
Built-in image stabilization for smooth video capture.
Internal 19GB storage for photo and video storage.
Wireless connectivity for remote control and sharing.

60MP 360° still images for high-resolution photography.
5.7K 360° video recording at 30fps.
2.25-inch touchscreen for intuitive control.
USB Type-C port for fast charging and data transfer.
MicroSD card slot for expandable storage.
.png)

.png)

Try it free. No credit card required. Instant set-up.







.svg)


.svg)